
Magazine Spread & Infographic Design
TechCrowdCourse Assignment for SNHU Class 330
PURPOSE
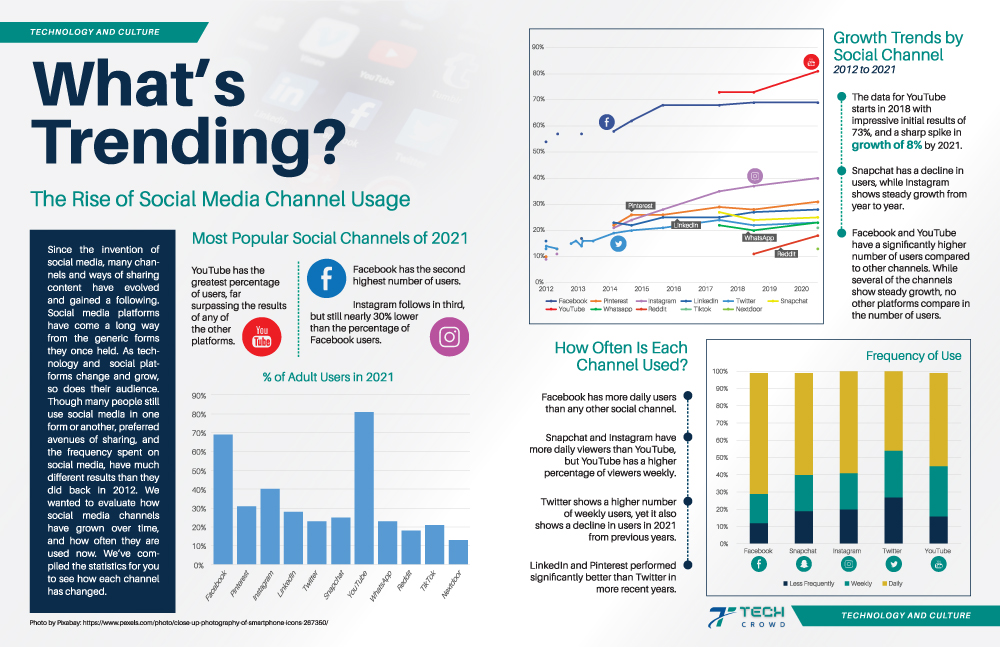
This design artifact was an infographic intended to serve as a visual representation of social media data to be included as a two-page spread in TechCrowd magazine (as part of a college course assignment for GRA 330). The readership of the TechCrowd magazine includes men and women aged 28-45 who have an interest in business, technology, and data-driven information. To be effective, this infographic needed to be visually appealing, conforming to the TechCrowd brand identity, and the rest of the magazine. It also needed to display attractive visuals that represented quantitative data in a way that was both interesting and easy to understand the results and correlations.
DESIGN RATIONALE
The concept of this ad was to highlight statistic data related to social media usage, so it features a subtle image of social media icons in the background of the header. This also creates a visual representation to tie in with the heading text. Colorful social media icons are also used throughout to highlight key information. Principles of design are used to create a balanced design. Shape and color are used to highlight information as well as create structure and repetition. Alignment, size, and color are used on the text to create a hierarchy to guide the viewer from one section to the next. This design meets the audience’s requirements by taking boring numerical data and turning it into an interesting and easy to understand visual. These visual representations would not only fit well into the magazine, but they would also be visually interesting to the magazine’s audience. The data could be relevant to the readers by providing valuable insights into when and how to reach their potential customers, and which channels would be best, based on their needs. The visual representations also make it easier to identify trends and correlations that would be more difficult to notice when just looking at sets of numbers.